Structure Matters: Scientists Create New Guide to Compare DNA Maps
Listen:

Think of DNA as a long string, crumpled up within the tiny space of a cell’s nucleus. It might look disordered and bunched, but the way it folds matters. Which sections of DNA strands are buried deep within a clump, which are freely accessible, and which are close to each other is intrinsically tied to the rest of the cell’s function and behavior.
Comparing tightly packed DNA structures called chromatin—examining how they change over time, differ between health and disease, or vary across cell types—also sheds light on fundamental questions in biology, development, and medicine.
In recent years, a few methods have emerged as the ideal ways to map DNA organization; each visualizes data in the form of what’s called a “chromatin contact map.” Yet, it’s been tricky for scientists to compare hundreds or thousands of these maps at once because it involves grappling with difficult statistical problems.
Time and time again, individual research teams come up with their own comparison methods, leading to dozens of different approaches that often produce conflicting results—leaving scientists uncertain about which is best for their specific biological questions. Some methods are better at identifying tiny, subtle changes to DNA structures, while others point toward larger shifts.
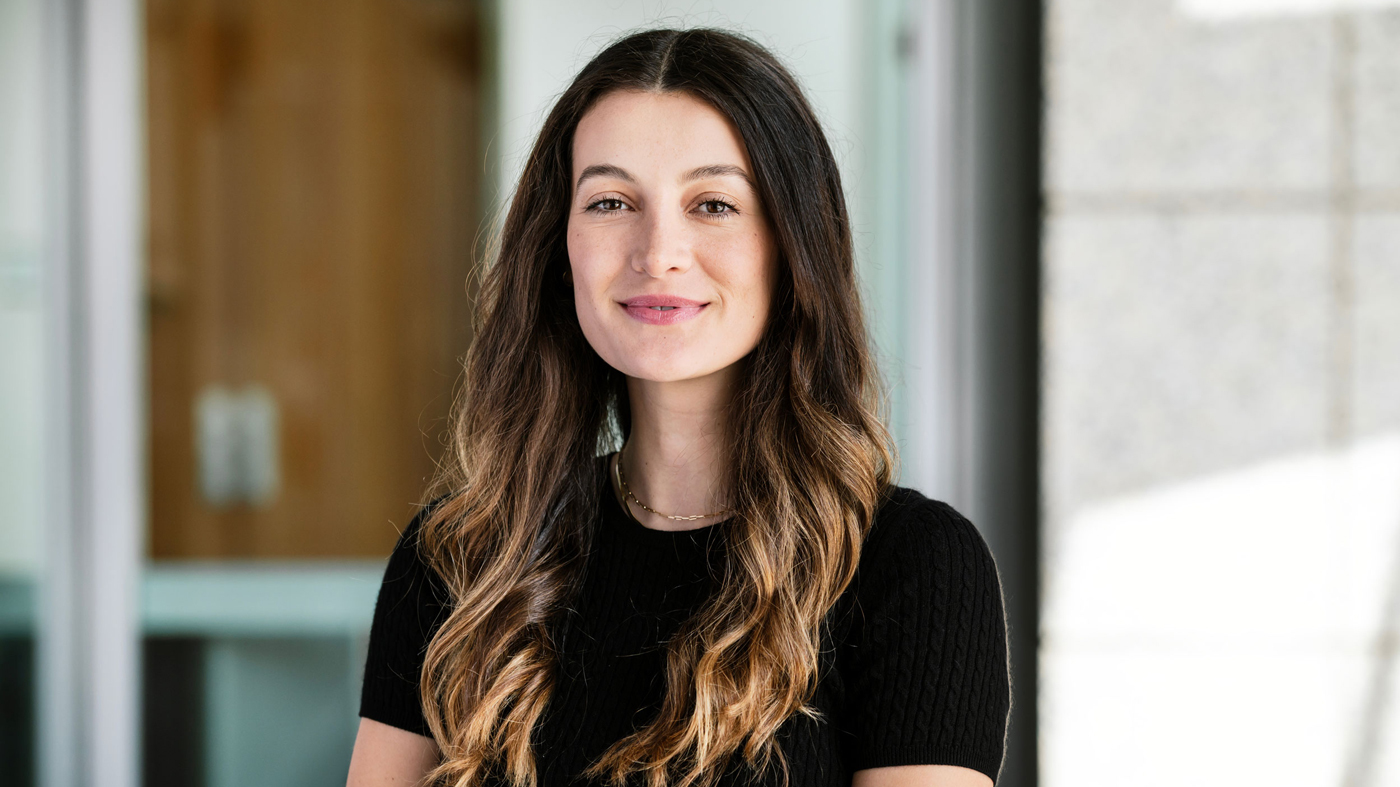
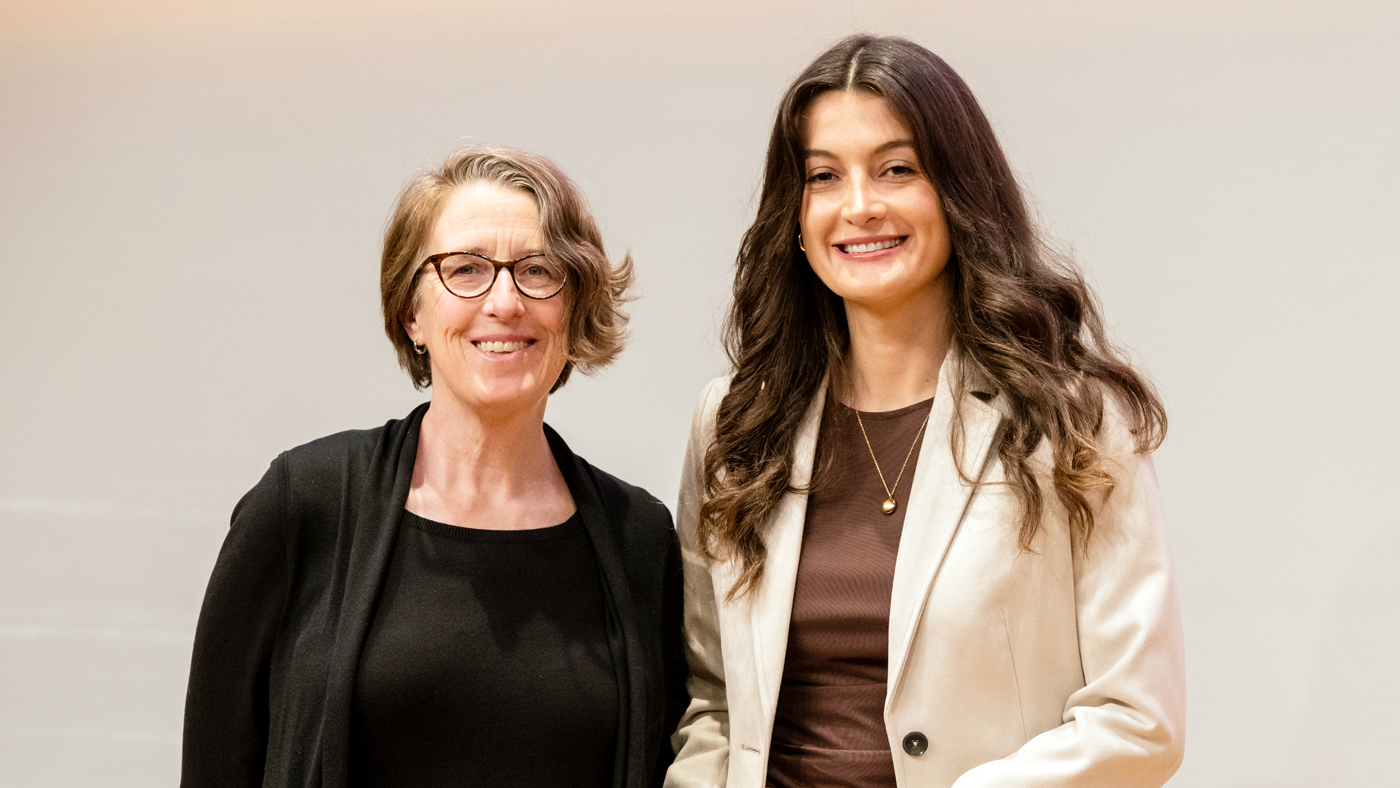
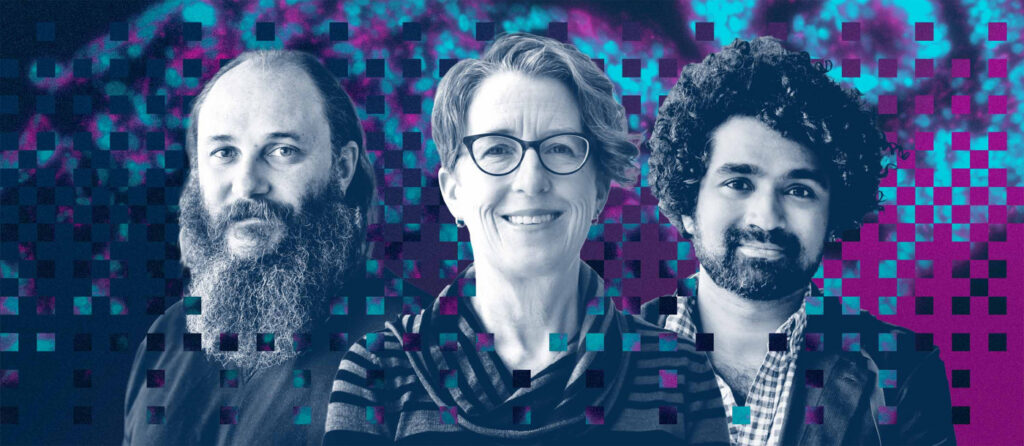
Now, a team led by Katie Pollard, PhD, director of the Gladstone Institute of Data Science and Biotechnology, and graduate student Ketrin Gjoni analyzed 25 different methods of comparing chromatin contact maps, with the ultimate goal of giving biologists and data analysts guidance on which to use when. Their results were published in the journal Nature Methods.
We sat down with Pollard and Gjoni to learn about the biggest takeaways from their study.
First, what is a chromatin contact map?
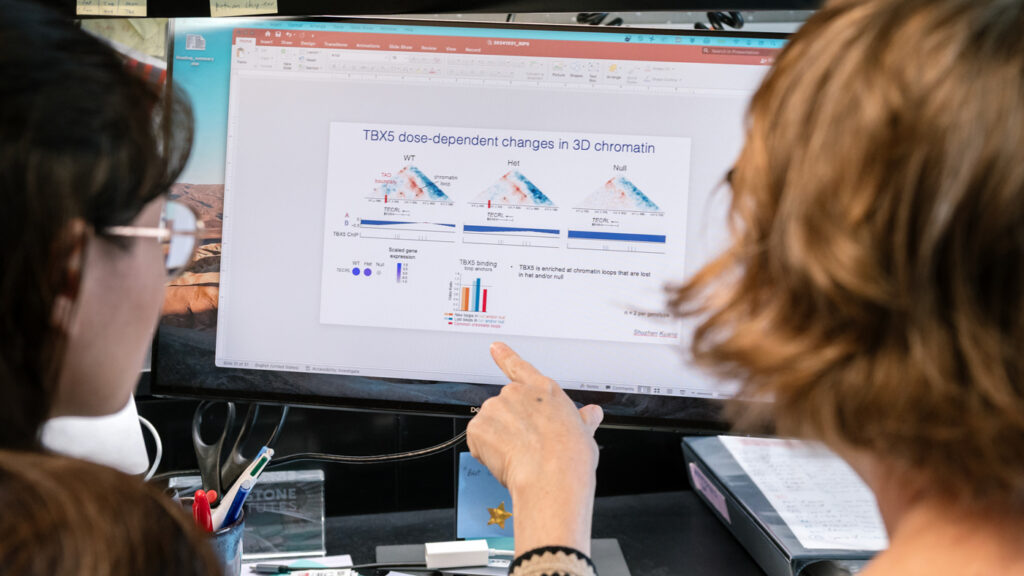
Gjoni: A chromatin contact map is a heat map that shows, for any given genome, which regions of DNA are physically interacting with each other or are close to one another.
These maps let us figure out how DNA is spatially organized within the nucleus of a cell. That organization can then tell us a lot about which genes are being turned on when, or how one small DNA change might be altering the whole architecture of a genome to affect many genes at once.
Why are researchers interested in DNA structure in the first place?
Pollard: Many scientists are becoming more familiar with programs like AlphaFold that predict how proteins fold. They understand that the way proteins fold up into a three-dimensional structure is key to their function, and that a mutation might change a protein’s function by first changing its structure.
It’s the same for DNA—structure matters a lot. Researchers use chromatin contact maps to investigate whether the genome folds differently in various biological contexts, like during development, in disease states, or between species. They want to determine whether these folding changes influence gene expression, replication, or other cellular functions.
We frequently use chromatin contact maps in my lab. For example, we’ve studied how chromatin organization changes during heart development by examining the transition from stem cells to beating heart cells. We’ve also compared how DNA folds differently between humans and chimpanzees, and how this structure changes in diseases such as autism, cancer, and heart defects.
Researchers use many different methods for comparing chromatic contact maps. Why was it important to study all of these methods head-to-head?
Pollard: We were launching a new project—using machine learning to predict how DNA folds—and needed to figure out the best comparison method to use. We initially planned to evaluate just a few methods to make an informed decision for our own work. But when we saw how much the methods differed, and how they could really lead to different results from each other, it became clear that a comprehensive benchmark was needed. Not just for us, but for the scientific community overall.
What stood out to you in your comparison of these methods?
Gjoni: We evaluated more than 22,000 pairs of chromatin contact maps to gauge how different methods respond to various types of structural changes. It was striking how two methods designed to answer the same general question (such as: “Are these maps different?”) could produce completely different results. We were also surprised that lessons learned in other fields did not translate perfectly to chromatin biology. For instance, the structural similarity index, or SSIM, commonly used in image analysis, performed especially poorly in our benchmark.
Did one method win out over the others?
Gjoni: No, not at all. It really depends on the biological question. The methods are so different, so it’s important to use multiple approaches and compare results, especially when trying to answer biological questions that are complex or nuanced.
For large datasets, we recommend starting with global methods that quickly highlight the most disrupted maps. Then, more specialized tools can be used to examine those maps in greater detail.
We created a summary table in our paper that guides researchers toward what they should consider, as well as an open-source code repository and framework that other scientists can use if they want to run their own analyses. We mostly want researchers to be more informed about the biases and implications of the methods they use.
What’s next for your lab?
Pollard: Now that we have a clearer idea of how well different methods work, we can apply them to interesting questions about disease, evolution, and development. What I’m especially excited about is using our machine learning program to predict how small genetic changes—such as disease-linked mutations—might affect chromatin structure. Once we have these predictions, we can go into cells, make those genetic changes, and test the genome folding to see if our predictions were right.
Ultimately, we hope that by understanding how genome folding changes, we can uncover new insights into genetic diseases, tumor formation, and developmental disorders—and potentially even guide new treatments. Being able to more effectively compare chromatin contact maps is a step toward that insight.
Up Next
Gladstone Launches Center for PhAIge Therapy to Harness AI in the Fight Against Drug-Resistant Infections
The center, funded by an NIH grant, will become one of three national centers dedicated to accelerating the development of phage therapy.

Gladstone Expands Research Footprint With 105,000 Square Feet of New Laboratory Space
Gladstone Institutes is adding state-of-the-art laboratories in a newly constructed Mission Bay building.
How AI Is Pinpointing the Genetic Cause of Disease
Scientists at Gladstone are combining AI models with cutting-edge lab tools to finally make sense of the human genome.

How AI Is Accelerating Life-Saving Discovery
Gladstone scientists are developing new AI tools that promise to revolutionize how science is done and lead to new treatments for the most devastating diseases.

Get Involved
Join the Team
Our people are our most important asset. We offer a wide array of career opportunities both in our administrative offices and in our labs.
Open PositionsPartner With Us
Discoveries don’t stay in our labs. Gladstone facilitates spinout companies to advance promising therapies, shortening the path between scientific discovery and helping real patients.
Learn MoreGive
Your gift to Gladstone will allow our researchers to pursue high-quality science, focus on disease, and train the next generation of scientific thought leaders.
Donate Now