

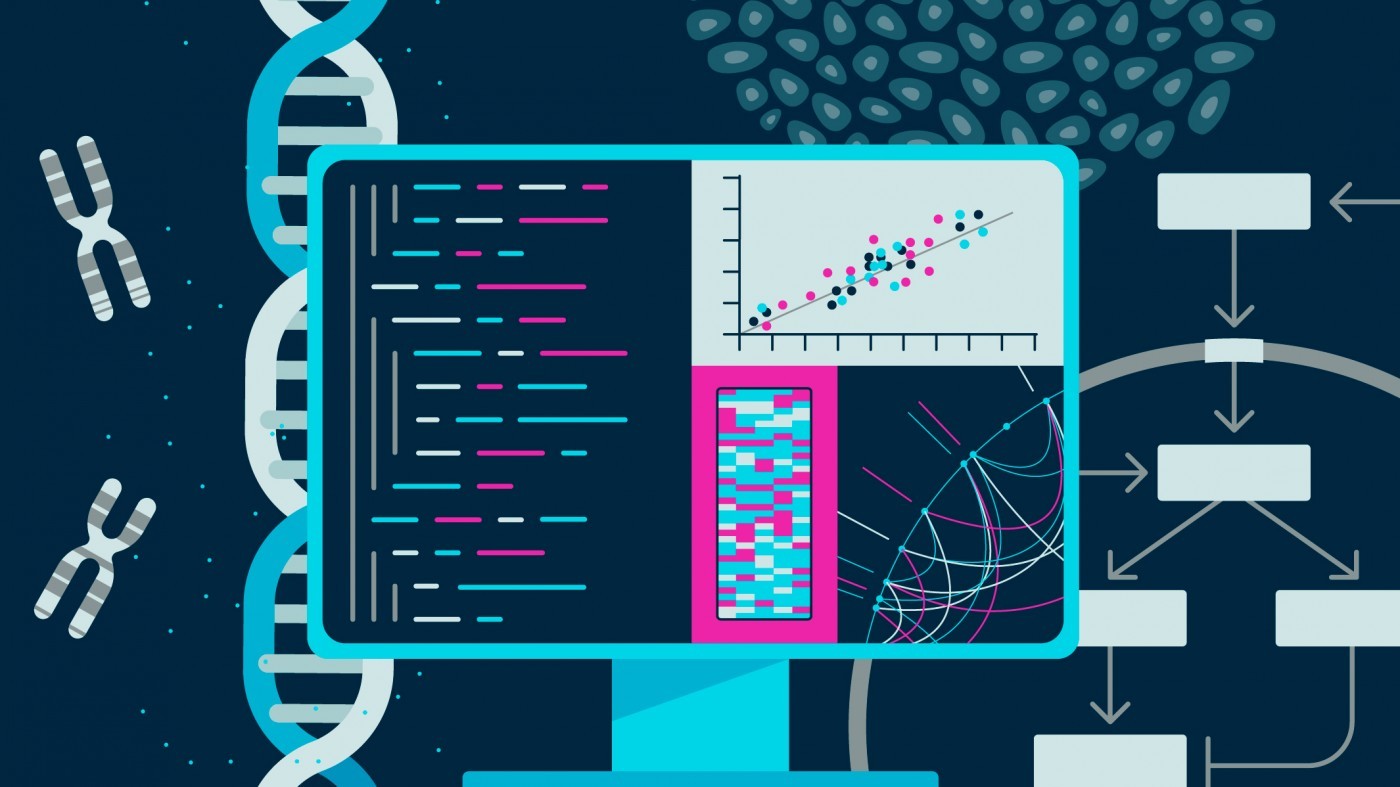
Gladstone researchers are using data science to make discoveries about human health.
A single human genome sequence takes up a few gigabytes of memory on a computer—the data can fit on a standard DVD for storage. A 3D image of a brain requires several terabytes—more storage capacity than many laptop computers. And a database containing information about every protein inside a cell, or a movie of stem cells growing and dividing for days—even more.
In recent years, biomedical research has undergone a data explosion; whether a scientist is studying cancer, Alzheimer’s disease, or a virus, they’re likely generating huge amounts of data. And with large datasets comes the need for tools and computational approaches to parse the data and find patterns. For researchers with a knack for data science, this means a plethora of opportunities to make discoveries by combining traditional biology with computational approaches.
At Gladstone, scientists are taking advantage of the fire hose of data that’s generated by many sequencing, proteomics, and microscopy technologies to make discoveries about human biology, health, and disease.
Historically, data science has most often been integrated into research after data is collected—as the final analysis step. Today, though—at Gladstone and around the world—data science approaches are being integrated into research projects earlier, to help guide what kind of data is collected in the first place.
“I think it’s far better for science to have data scientists right from the get-go helping develop hypotheses and drive decisions about experiments,” says Katie Pollard, PhD, director of the Gladstone Institute of Data Science and Biotechnology.
Finding the Needle in the Haystack
Many of the biological problems that the Pollard Lab tackles with its computational expertise involve finding and studying rare—but important—genetic differences within huge sets of data. Sometimes, that means sifting through thousands of patients’ genomes to find genes that cause disease. In other cases, it means developing new ways to analyze the hundreds of species of microbes that grow inside the human gut. These bacteria and viruses, dubbed the microbiome, affect human health in myriad ways. To study what makes one person’s microbiome different from another’s, scientists typically sequence the entire collection of genes—tens of millions of them—that are found mixed together in the gut.
“You get this big pile of DNA sequencing data, and the bioinformatics problem is that you need to infer not only which microbes are there, but also which function belongs to which microbe,” says Pollard.
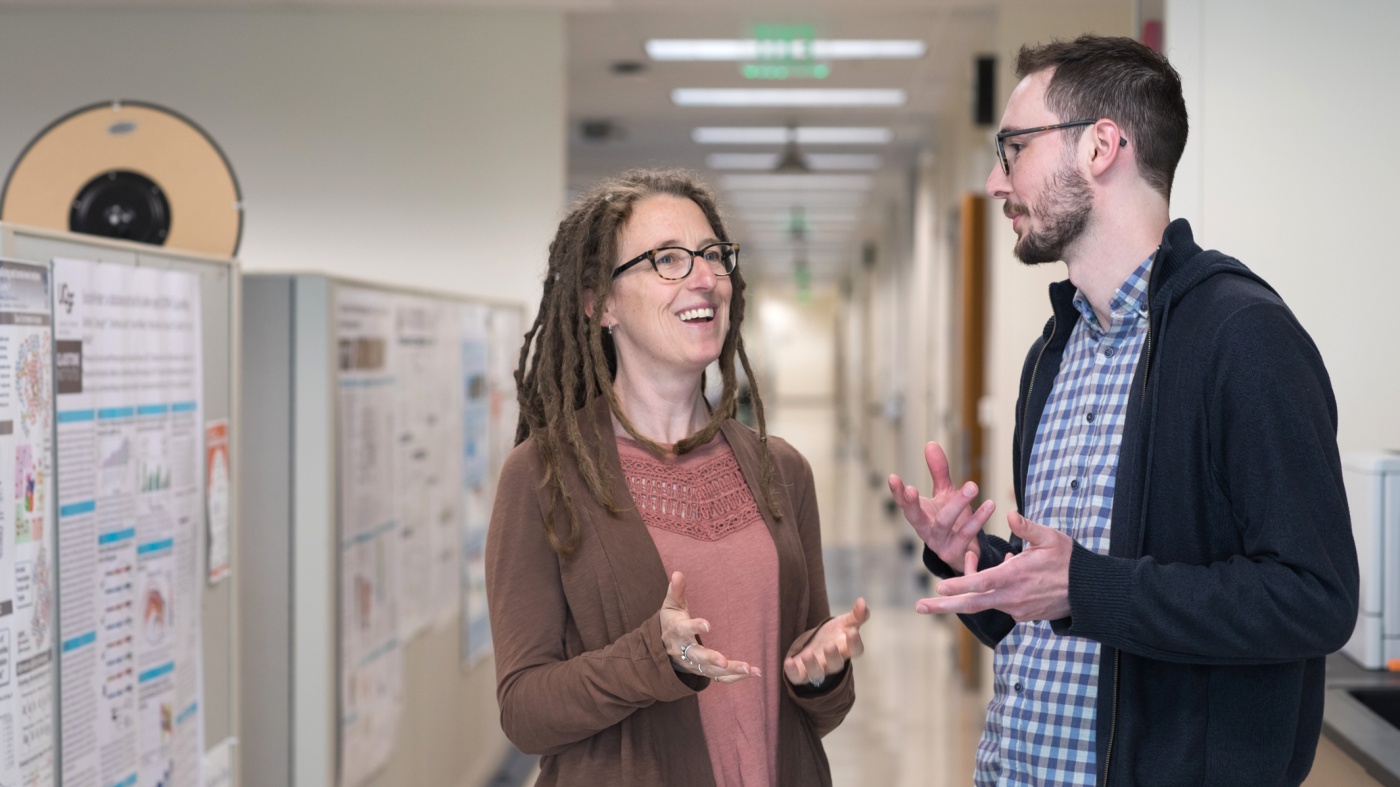
Katie Pollard (left) is the director of the Gladstone Institute of Data Science and Biotechnology
Genes that are present in the most common microbes are easy to pick out of that mixture, but more rare genes often remain hidden when the data is processed. To solve that problem, Pollard’s team is collaborating with researchers at the Chan Zuckerberg Biohub. They’re not only developing computational methods that can better analyze a typical microbiome data set, but also new ways of processing the physical data—stretches of DNA—before it’s sequenced in the first place. For example, the team has two methods to enrich the genes of rare microbes compared to those of more common ones so they can study them in more detail.
Pollard uses similar approaches to collaborate with Gladstone researchers who study heart, neurological, and immune disorders. In each case, she helps design and apply computational approaches to the deluge of data that researchers collect on the genetics of disease, with the goal of pinpointing rare mutations linked to the diseases.
“It’s fun for us to be the data science people,” she says. “We can work on a lot of different biomedical problems because the machine-learning tools we create can be used across all sorts of diseases.”
Beyond finding rare gene variants, Pollard’s methods can also help shed light on the function of some stretches of regulatory DNA. That’s because regulatory genetic elements work by affecting the activity of genes; finding which genes they act on, out of all the genes in the human genome, is the same kind of computational puzzle as homing in on disease genes.
For more than 15 years, Pollard has been studying one particular kind of genetic element—quickly evolving regions of the human genome known as Human Accelerated Regions (HARs). Pollard discovered HARs as a postdoc, showing that these stretches of DNA rapidly changed when humans evolved from primate ancestors.
In the past, Pollard and others studied the effect of HARs by selectively deleting them from cells one by one. Now, her team has engineered a system in which each HAR is tagged with a unique barcode and added to stem cells. Using the barcodes, the researchers can simultaneously track the effect of each HAR during the differentiation of stem cells into heart or brain cells. Pollard has evidence suggesting that HARs not only contribute to making humans unique from other primates, but that variations in HARs could explain some disease susceptibility.
In short, Pollard’s group is interested in identifying the differences between genomes, and how those differences emerge over time—whether those genes contribute to inherited heart defects, compose the microbiome, or make us human.
“It seems like a hodgepodge of projects, but it’s all unified by this evolutionary approach to the question of how organisms change as their genetic sequences change,” says Pollard.
Seeing What the Human Eye Can’t
While a genetic sequence, in its most raw form, is a series of letters—one for each base pair—an image of a cell or a molecule can be described as a matrix of numbers—one for each pixel that makes up the picture.
“That makes images very well-suited to mathematical analyses,” says Gladstone Director of the Center for Systems and Therapeutics Steve Finkbeiner, MD, PhD, who uses machine learning and artificial intelligence to study neurodegenerative and psychiatric diseases.
If you placed a hundred pictures of brain cells—some from healthy individuals and some from people affected by Parkinson’s disease—in front of a researcher, they would struggle to find patterns that distinguish healthy from diseased cells. Sorting through the pictures would be overwhelming and time-consuming. But feed the same hundred pictures into a machine learning algorithm, and the computer program can quickly pick out differences, Finkbeiner and his colleagues have shown.
“We’ve been able to train deep learning algorithms to see things in images that humans just can’t see,” he says. “These approaches allow you to do stuff that is superhuman.”
Importantly, though, those approaches don’t just allow researchers to wade through mountains of data, they actually require mountains of data to discover patterns. This should drive scientists to innovate new ways of generating image data at a grand scale, Finkbeiner says. To do that, Finkbeiner’s team invented robotic microscopes with the capacity to track individual cells over the course of weeks.
Finkbeiner believes that one day computers will be able to diagnose patients, or even guide their treatment, by analyzing pictures of their cells, without the need for a human to stare at microscope slides for hours. When his lab tested the approach with ALS—teaching a computer algorithm to differentiate between healthy cells and those affected with ALS—they discovered that the computer could make a correct diagnosis.
His group has also turned to facial recognition software—not to recognize faces, but to recognize individual cells in a colony. They’ve shown that they can track individual cells as a culture grows. And that can help with research on what makes cells within a complex group different from each other. For example, Finkbeiner’s group is collaborating with cancer researchers to probe why some cells in a tumor respond to a drug while others don’t.
The challenge of tracking cells over time is one that Gladstone Senior Investigator Todd McDevitt, PhD, also focuses on. He wants to know how cultures of stem cells self-organize and form patterns. Understanding this can let researchers better control the shape of their own cell cultures—something that’s necessary to form complex cultures that better mimic the organization of functioning organs.
McDevitt’s team recently trained a machine learning algorithm to predict the patterns that would form in a stem cell colony based on starting conditions. He describes the work as being a very iterative process; his group can test the predictions made by the machine learning program, and then use the results to refine the program further.
Machine learning predicts conditions that will cause stem cell colonies to form desired patterns. (left) Video showing simulated interactions. (right) Stem cells grown in conditions dictated by the machine-learning program generate a colony that forms a bull’s-eye pattern, as predicted.
“What’s intrigued me the most about using machine learning is being able to use in silico power to help guide and direct the hypotheses for our experiments,” says McDevitt.
His group is now applying a machine learning approach to time-lapse videos of cell colonies, rather than just static before-and-after snapshots. They capture images of stem cell colonies every few minutes for a day or two, as the stem cells differentiate into multiple types of adult cells. Then, they analyze how changing the conditions of the cell culture, such as adding growth factors, alters the action of the cells. “All of a sudden, there are new insights you can extract from the video data that we wouldn’t identify otherwise,” McDevitt says.
Predicting Outcomes at the Molecular or Pandemic Scale
In the time of COVID-19, most of the public is well-aware of the curved exponential shape depicting the spread of a disease. But it’s not just during an epidemic that infectious disease researchers rely on data science to understand pathogens.
“At every single level, mathematical modeling has been seminal in moving infectious disease research forward,” says Director of the Gladstone Center for Cell Circuitry Leor Weinberger, PhD. “We use modeling to understand person-to-person transmission of diseases, to understand viral replication and half-life and resistance in individual people, and to understand circuitries and protein turnover inside individual cells.”
For instance, Weinberger’s lab wanted to know how protein levels varied between different cells infected by HIV. They thought that natural, random variations in gene expression level might explain how viruses could alternate—seemingly randomly—between being latent and active.
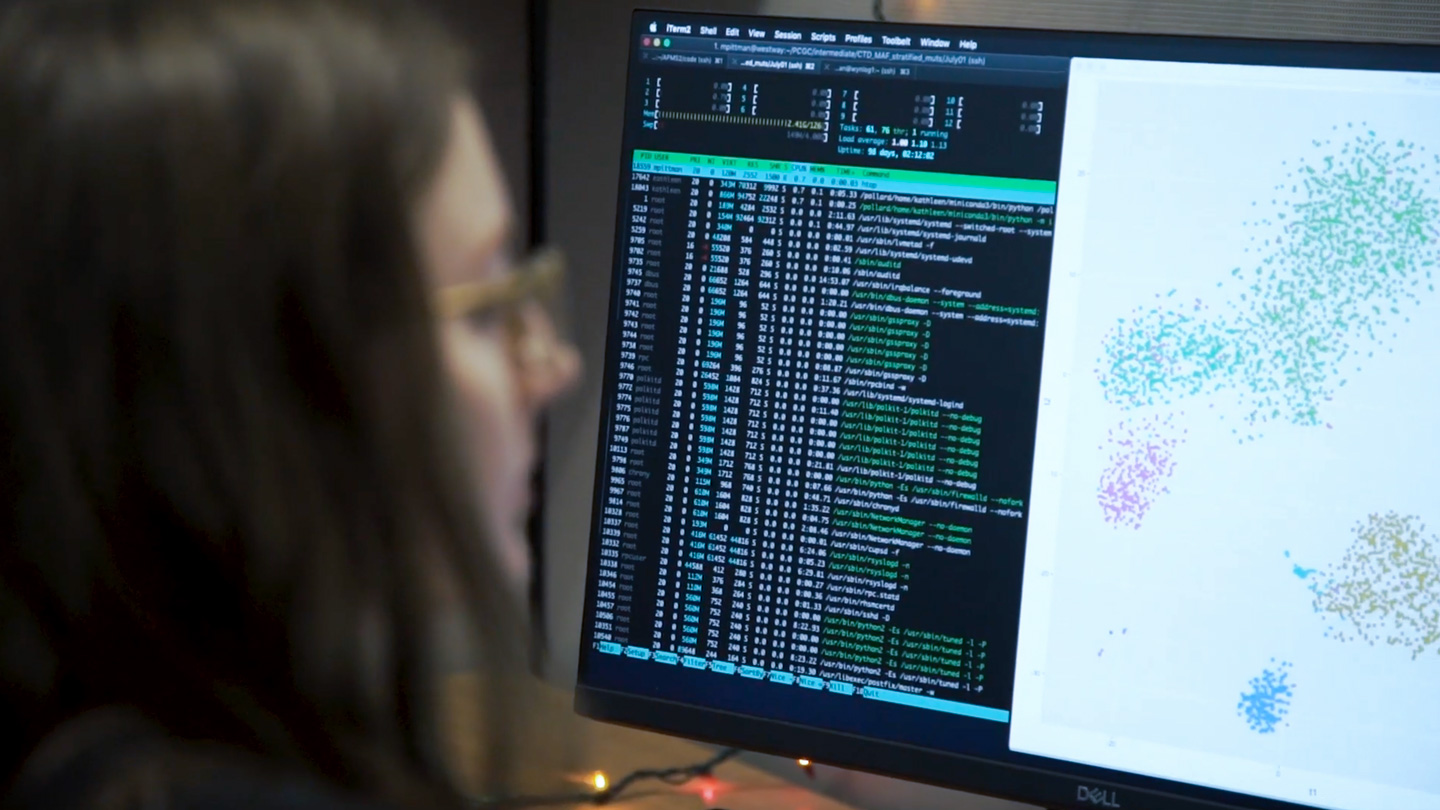
Gladstone scientists use computational tools to answer biological questions.
Studying this variation meant measuring levels of gene expression in the cell—in thousands of cells—and then analyzing the massive set of data. It also required developing computational tools to process those data and to model how fluctuations in protein levels could lead to latency. The work is still ongoing, but Weinberger’s team has already reported that the variance drives HIV to switch between latent and active states. Now, the challenge is to figure out a way to control this switch.
Weinberger’s group has also modeled infectious disease at a much larger scale—studying the potential impact of an HIV therapeutic on the population of Malawi, in central Africa. He ran the first simulated models more than 20 years ago, when the therapy—a compound that competes with HIV inside infected cells, without causing disease—was just an idea. “We did modeling to ask whether it was worth trying to engineer the therapeutic,” he says. “If it doesn’t work in the computer, there’s very little reason to spend the millions of dollars to develop it.” Based on those initial models, Weinberger decided to forge ahead with the project; he’s now shown that the therapy, which can co-evolve with HIV because it faces the same pressures inside a cell, works to treat HIV in mice.
Mapping and Visualizing Networks of Molecules
The emergence of high-throughput techniques to probe the DNA, RNA, and proteins inside cells has led to a new understanding of how the components of a cell interact within networks. Mapping these interactions can help researchers identify the cellular drivers of disease and how to treat them. But putting together—and visualizing—these complex networks takes specialized data algorithms.
“There are bioinformatics required for individual datasets, but even more importantly, bioinformatics required to merge different datasets together for the bigger picture,” says Gladstone Senior Investigator Nevan Krogan, PhD.
Krogan’s research group has combined the targeted genetic editing technology CRISPR with mass spectrometry—an analytical technique to characterize proteins. They use computational biology to merge the data from the two, vastly different, types of experiments, and paint a picture of how proteins interact within cellular networks.
In one recent study, Krogan and his colleagues used CRISPR to selectively remove genes from human cells and study which ones—when removed—affected the ability of an enterovirus to infect the cells. Then, they used mass spectrometry to identify which proteins in human cells interacted with viral proteins. When they combined the two sets of results, they pinpointed one particular gene that seemed to be key to the virus’s ability to infect human cells. They’ve carried out similar experiments on Zika, Ebola, and dengue viruses and are now applying the approach to the coronavirus that causes COVID-19.
“The bioinformatics is really woven all the way through this,” says Krogan. “To me, the real power is the ability to put data types together and look for the commonalities that exist between them.”
After assembling the data, there’s another step required to visualize them and make them accessible to other researchers. That’s when Krogan—and many others—rely on work that’s been done in part by Alex Pico, PhD, a Gladstone senior research scientist and director of the Gladstone Bioinformatics Core.
“I build network and pathway tools that can be applied to any field of research,” says Pico. “How genes and proteins interact is really relevant to any biological question.”
In 2006, Pico and others at Gladstone joined a consortium that designs and runs Cytoscape, an open-source bioinformatics software platform that lets researchers turn their network data into figures for publication or reference. While small network diagrams can be drawn by hand on a basic program like PowerPoint, it’s not feasible to use this approach for networks that include tens of thousands of genes and proteins. That’s where Cytoscape comes in. The program, which Pico helped write the code for, is downloaded more than 18,000 times a year, he says, and has been used to create most network figures that appear in peer-reviewed journals.
“This is the true opportunity for data science to overcome disease.”
Pico relies on feedback from users like Krogan to find out what features would come in handy or what’s not working about the program. He and the rest of the Cytoscape consortium—which includes data scientists from around the world—are currently working on new online tools that don’t require software installation.
Pico’s group also spends time refining a large database called WikiPathways that Pico conceptualized when he was a postdoctoral fellow at Gladstone. WikiPathways lets scientists contribute their own network data, and links it all together in a searchable, dynamic way.
“It brings what was previously just an image—a drawing of a network—into the data science realm so we can apply all sorts of algorithms to it,” explains Pico. A researcher might want to know what network a particular gene belonged to in order to predict how its mutation might affect biology, for instance.
Pico’s group is also leveraging the power of WikiPathways to shed light on COVID-19. The researchers extracted pathway images from thousands of coronavirus-related articles, and identified 221 published pathway figures. Those pathways are now available for other researchers to use to investigate how COVID-19 causes illness, and how it might be disrupted.
An Integrated Approach
Some researchers who integrate data science into their biomedical research have devoted immeasurable time and energy to doing so; they have lab members who specialize in statistics or machine learning or programming code. But many others don’t have the resources for this kind of effort; they instead rely on collaborations with data scientists, or data science cores, to help them parse their experimental datasets in new ways.
“A lot of biologists are more artists than they are accountants,” says Finkbeiner. That’s not a bad thing, he points out, but can lead to challenges when they launch collaborations to analyze their data. “It’s often a huge communication problem because computer scientists may be unfamiliar with biology. It takes concerted effort and a long period of time to develop a good collaboration.”
Pico and his colleagues want to narrow that communication gap, and one way to do it is to ensure that biologists-in-training are well-versed in computational approaches. To that end, the Bioinformatics Core runs training programs and workshops, and reaches out to researchers who they think they might be able to help. “We’re really trying to make sure that the current generation of trainees at Gladstone leave here with more bioinformatics and biostatistics knowledge than average,” says Pico.
At Gladstone, well-oiled collaborations between data scientists like Pollard and Pico, and biologists working with cells and tissues, are already made easier by the close-knit community and small size of the organization, Pollard says. “Being all together in one building really makes it easier to work together,” she says. “Historically, a person with my expertise wouldn’t be making decisions about the direction of biomedical research projects; I’d just have someone come tell me what they needed analyzed. But it’s really been my cultural mission for Gladstone to change that. This is the true opportunity for data science to overcome disease.”
Support Discovery Science
Your gift to Gladstone will allow our researchers to pursue high-quality science, focus on disease, and train the next generation of scientific thought leaders.
Reflections on a Pandemic: 6 Questions with Melanie Ott

Article
December 11, 2023
Reflections on a Pandemic: 6 Questions with Melanie Ott
Melanie Ott, director of the Gladstone Institute of Virology, reflects on the breakthroughs driven by the COVID-19 pandemic and explains why virologists’ work is never done
Gladstone Experts COVID-19 Virology Ott LabA New Therapeutic Window for Patients with Genetic Neuropathy Disorders

Article
September 12, 2023
A New Therapeutic Window for Patients with Genetic Neuropathy Disorders
An 8-year-old with CMT meets with Gladstone researchers
Gladstone Experts Conklin Lab40 Years of HIV Research: Celebrating the Career of Virologist Warner Greene

Video
April 20, 2023
40 Years of HIV Research: Celebrating the Career of Virologist Warner Greene
Colleagues look back on Warner Greene's 40 year career
Gladstone Experts History HIV/AIDS Virology Greene Lab